Graph
| Category | Price | Seller | Device |
|---|---|---|---|
| Productivity | Free | VVI | iPhone, iPad, iPod |
• Makes graphs from numbers.
• Made by the data visualization expert - VVI®.
• Touch-hold a graph to email, print or save to your Photo Album.
• Plenty of built-in options.
• AirDrop your graph to the most powerful data visualization application on the iPad, Graph IDE.
FEATURES
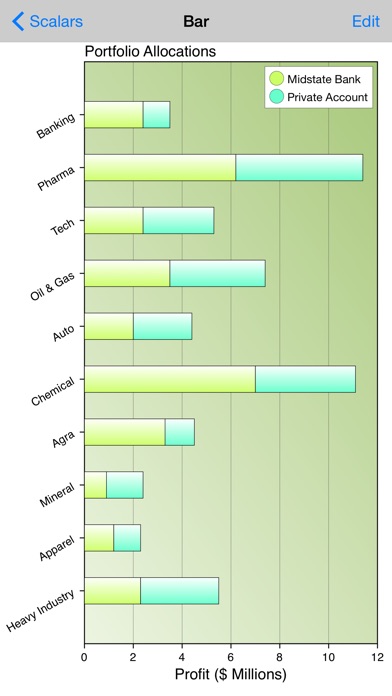
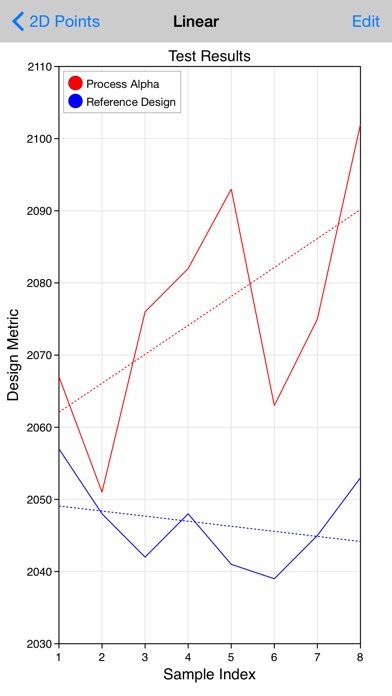
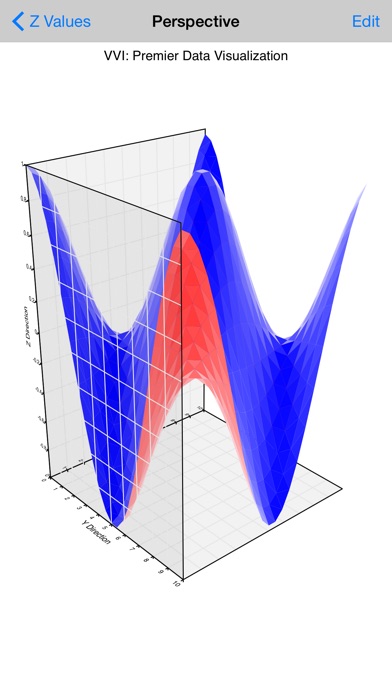
• Includes several 1D, 2D and 3D graph types such as bar, column, pie, line, area, scatter, 3D perspective scatter, trajectory and surface, volumetric, z-sliced cell, maps, linear, semi-log, x-log, log-log, polar, r-log, Gregorian date and many variations.
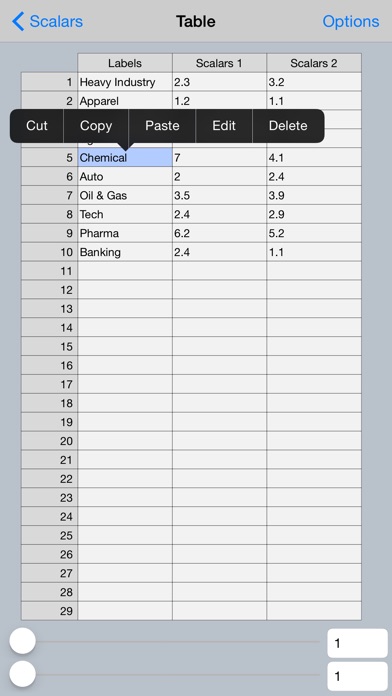
• Data is pasted from the pasteboard and inserted and edited using a table interface.
• Touch-hold a graph to export it to Graph IDE on the iPad. Graph IDE is the most powerful data visualization application for the iPad and gives access to a wide variety of graph types and graphical effects. (Graph IDE is separately available for the iPad).
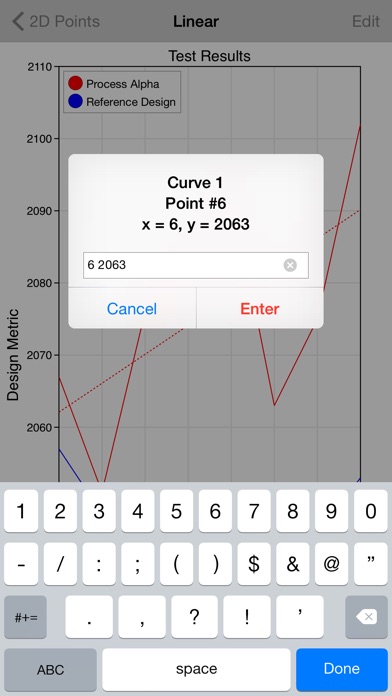
• Touch graphs to rotate, zoom, scroll and scan data.
• Touch data graphics, such as lines and bars, to show data values.
• Touch-hold a graph to copy, print, mail, AirDrop and save it to other applications.
• Data and preferences are organized by project and each project is persistent and automatically saved so you can show and retrieve your settings and data on subsequent use.
NOTE: Continued use of GPS running in the background can dramatically decrease battery life. The Location Tracking task requires GPS for its function.
ADD-ON
The in-app purchase enables the Least Squares, Error Bars, Location Tracking, Weight and Health tasks and removes ads.
Reviews
Thanks!
FluffyKitty200
(After Developer Response) Thanks for responding so quickly! I found out what made it crash and it was because i had WAYYY to many apps. So I deleted some unwanted apps and then i tried and it worked! (Before Developer Response it doesn't even work! Whenever I click on something it just crashes! Also the ONE THING I downloaded this app for (a pie graph) isn't even in the app! ? Im really disappointed. (Edit For Before The response) Didn't mean to sound so dramatic there... but still Also if I dont get a reply soon it would be a waste of my time so I will just delete it.
Smh!
Melszz
Terrible, looks terrible works terrible. I don't see the need to be able to graph something while I'm in mid-air flying to china!
Great app and excellent service!
Tomutomo
This is a very versatile graphing app and is perfect for showing progress in my studies. The author is VERY responsive - I had a couple of questions which were answered immediately. Completely satisfied; thank you so much!
Awful
anGIR hunGIR and danGIR
You can't jut put in coordinates it's hard to work and it doesn't even show you your graph just an example
Needs tutorial
fendstat
Learning curve is too high. I need to easily see how to enter data and how to set up graph. However, if this is fixed app has great potential.
Great app!
talestuff.com
Easy to use and great customer support!!! I had a question about fetching data from a url and received an answer in 15 minutes. If you can't find an answer on the support site just email the developer.
!!!!
Monkey1717
I just can't understand how to put in points on the graph! It is waaaaaaayy beyond frustrating.