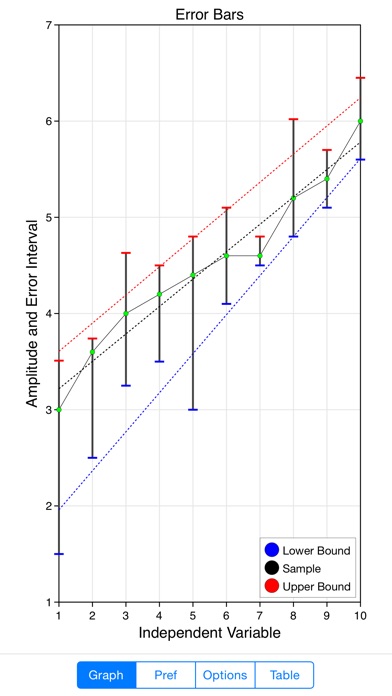
Error Bars
Error Bars is used to show error bar data, aka: low/high/close data. It also shows low/high/close trend lines (linear regression) to indicate the trend deviation of the data. Touch a toolbar button to alter data and attributes. Touch-hold the graph to send it to others. Use the table interface to alter numeric values. Touch data on the graph to edit data directly. If you need more features (which results in additional complexity) then try the Expert setting. Features error bars and trending on linear, semi-log, x-log and log-log coordinates.
| Category | Price | Seller | Device |
|---|---|---|---|
| Productivity | $0.99 | VVI | iPhone, iPad, iPod |