Vernier Graphical Analysis GW
| Category | Price | Seller | Device |
|---|---|---|---|
| Education | Free | Vernier Software & Technology | iPhone, iPad, iPod |
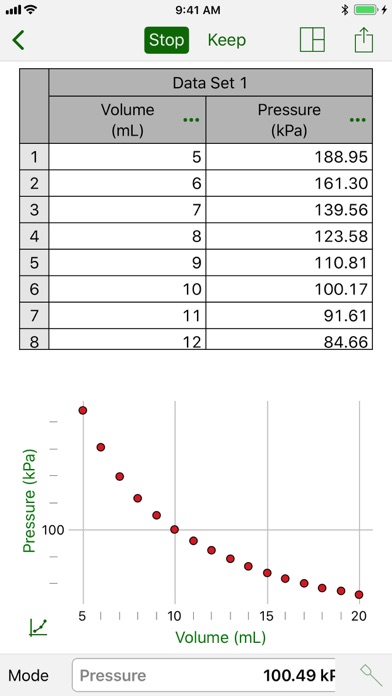
Graphical Analysis, in combination with supported hardware, makes it possible to use your mobile device to collect data from a wide range of Vernier sensors, including temperature, motion, force, pH, and more. You can also collect data from your mobile device’s built in accelerometers or manually enter data into the data table for analysis. Data can be wirelessly streamed to each member of a lab group using the Data Share features of LabQuest 2 or a computer running Logger Pro.
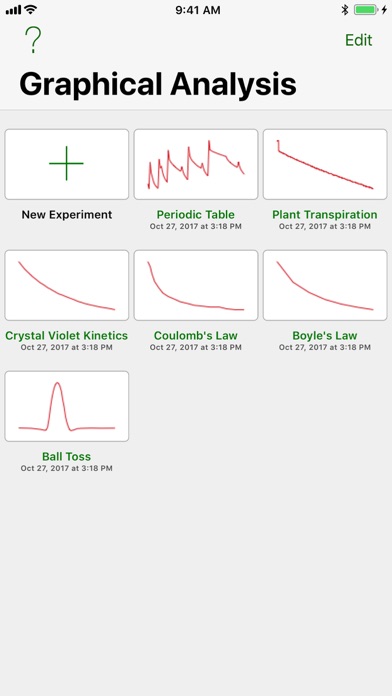
Once data have been collected or entered into Graphical Analysis, students can analyze the data, export data and graphs to create a lab report, or send their finished work to the teacher. Graphs can be exported to Photos, Mail, or note-taking apps, or printed on a printer. A CSV file of the data can be shared with other users or opened in different software, such as a spreadsheet program, for additional analysis.
Key Features - Data Collection
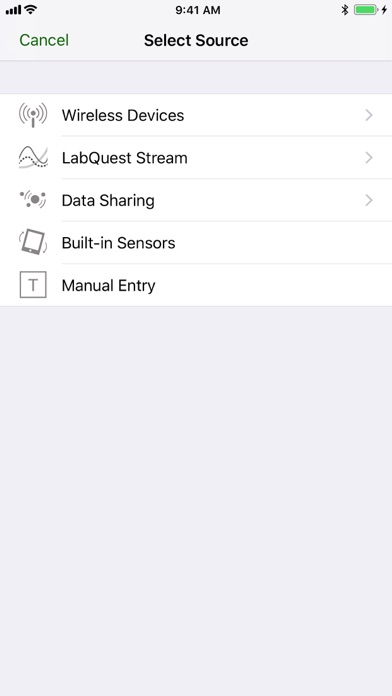
• Collect and analyze data from a Go Direct sensor
• Use LabQuest Stream to collect data from up to five sensors simultaneously.
• Collect and analyze data from a Go Wireless sensor or Go Wireless Link and a compatible Vernier sensor.
• Stream data to multiple students from a single source via wireless Data Sharing with LabQuest 2 or Logger Pro.
• Collect acceleration data using your mobile device's built-in accelerometers.
• Collect time-based or event-based data.
• Manually enter data and analyze them using Graphical Analysis.
Key Features - Data Analysis
• Display one, two, or three graphs simultaneously.
• View data in a table.
• Edit and auto-save data, graphs, annotations, statistics, and curve fits.
• Draw predictions on a graph.
• Pinch to scale graphs.
• Examine and select data.
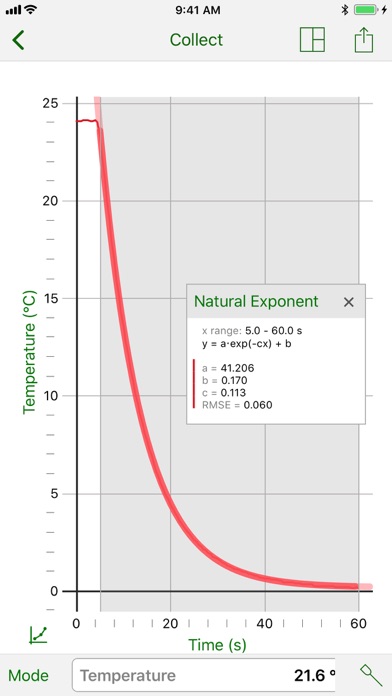
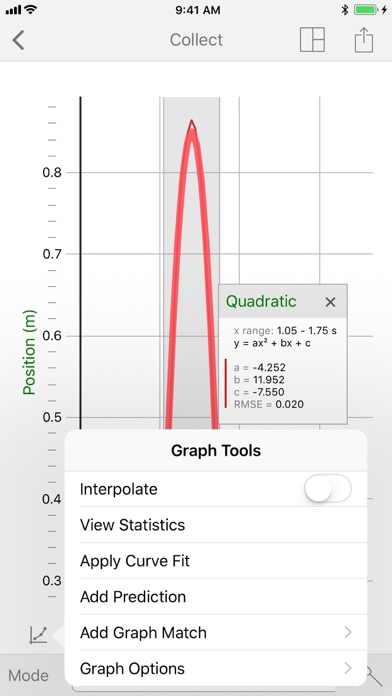
• Perform curve fits, including linear, quadratic, natural exponent, and more.
• Create text annotations and add graph titles.
• Export graphs and data.
Vernier Software & Technology has over 35 years of experience in providing effective learning resources for understanding experimental data in science and math classrooms. Graphical Analysis is a part of our extensive line of sensors, interfaces, and data-collection software for science education.
Reviews
Works well, but is missing some essentials.
CAN090872
My classes have been using this app to do labs on their Ipads with our LabQuests. However, some of the features seem clunky when creating graphs by manually inputting data. In addition and most importantly there needs to be an integral function as I teach physics. There are a lot of times where this is essential. It can be done on the LabQuest but does not transfer to this app. It doesnt make sense to not have this function. It would be great to see this added and would make this a 5-star app.
Graphical analysis
dee phone4
This app does not have all of the functionality of the program. I would have been delighted to pay for the full version of the program but I feel that I wasted my money! Dee cochran Senior lecturer at IUS
Vernier Graphical Analysis
rkiliansmith
This app is a huge advance through Vernier and their Labquest device. For the world of data collection, especially for schools that have deployed this technology with students along with iPads. This is a must have for science and math. Be sure to download the manual from the Support area of the Vernier site.
Graphical Analysis
Mongoose50
Very nice for graphing and curve fitting. Just wish I could integrate.
Not that good
35Anonymous:(
It doesn't let view differ graphs such as velocity vs time graphs or acceleration vs graphs. Also you can't change the units for x and y, and do calculations to change the graph or to linearize it?
Cool!
Physicsdave
I love the new Data Share functionality in Logger Pro that allows the use of GAi with all sorts of Vernier interfaces. GAi is maturing nicely.
Limited on big files
Jackbarbarian
Everything is great except when I imported a big file from Logger Pro 3, it crashed. Please fix!!!
Great app, makes class time more production
tachyonbb
A good app which is made great by the data sharing capability. Time to revise my lab manual to take advantage of these new features. As another reviewer said, it is maturing nicely.
Not very useful
Teach919
This app doesn't really do graphical analysis. It let's you enter data and view graphs of it, but it doesn't let you do a linear fit or statistical analysis, and the files it creates aren't even readable by Vernier Logger Pro. Definitely not worth $4.99 times the number of students in my class. Update: After a week and a half of frustration and in house IT support involving uninstalling and reinstalling Logger Pro and reconfiguring the firewall on our student network, we now have this app working well. I still can't find a way to add a calculated column from within the app. If they could add that capability, and better help menus within the app, I would give it 5 stars.