Technical Charting Free
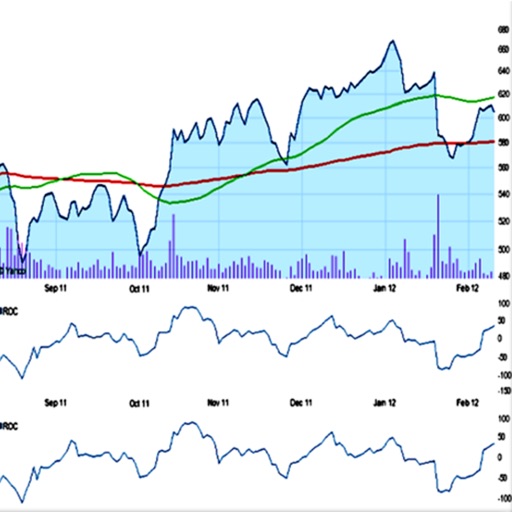
The chart analysis combines the popular technical indicators MACD, Moving Averages, Stochastic, RSI (Relative Strength Index), various volume oscillators, Money Flow Index, Rate of Change, Volume with Moving Average, Williams Percent Range, Bollinger Bands, Parabolic Stop and Reverse, Splits.
| Category | Price | Seller | Device |
|---|---|---|---|
| Finance | Free | Chris Werner | iPhone, iPad, iPod |


Chart mid and long-term stock technical analysis based on recent price trend, volume and volatility.
KEY FEATURES
-Date range 1 day to 5 years
-Line, Bar and Candle charts
-Linear and Log scaling
-Small or Mid-Size charts
-Moving Averages
-Exponential Moving Averages
-Nine technical indicators
-Four overlays
Reviews
Worst app ever
Pe54608
Only thing this does is send you to advertising pop ups. Can't view any charts. Just ads!