ReportPlus Data Analytics
| Category | Price | Seller | Device |
|---|---|---|---|
| Business | Free | Infragistics Business Solutions, Inc. | iPhone, iPad, iPod |

“I have found ReportPlus to be fantastically useful. Dashboards not only help keep people up to date. They make a fantastic presentation tool for meetings."- App store review
Featured in the US App Store (10 Countries, 12 Categories Overall)
Track all your key metrics and data for your entire business with ReportPlus. Try it free for 30 days and enjoy the freedom to work anywhere from your iPhone, iPad, and your desktop.*
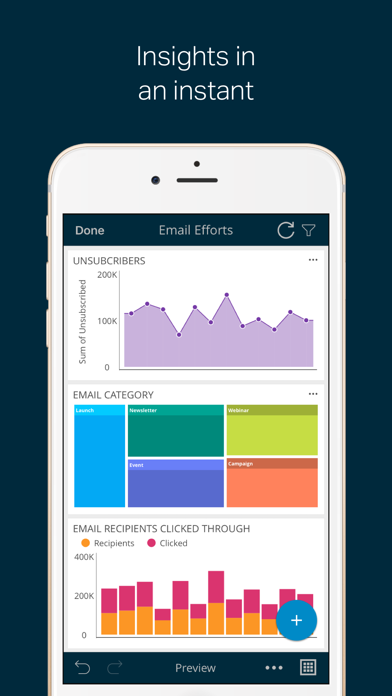
ReportPlus empowers you to create dashboards and visualizations connected to real-time data. Insights can be shared with clients, co-workers, or to impress your boss ;)
Connect to live data:
• Spreadsheets: Excel, CSV, Google Sheets.
• Content Managers: Dropbox, Google Drive, SharePoint, Box, OneDrive.
• CRMs: SalesForce, Microsoft Dynamics CRM.
• Datastores: SQL Server, Analysis Services, SSR, MySQL, Oracle, Sybase, PostgreSQL, Hadoop Hive.
• Social: Facebook, Twitter.
• Analytics: Google Analytics, Flurry, appFigures.
• Many more: Odata service, IMAP Mail Server, User Voice, Web Resource.
Combine 2 data sources into one visualization as well!
Create anywhere:
• Create charts and dashboards on your iPhone, iPad, or desktop computer.*
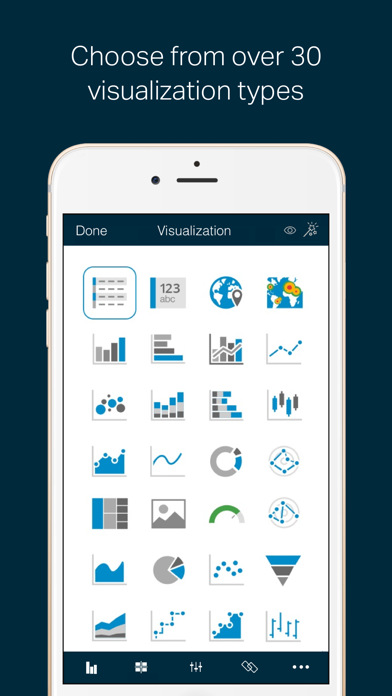
• Choose from 23 different visualization types including bar, column, donut, area, stacked, bubble, and pie charts, maps, tables, KPI gauges, and many more.
• Create interactive charts and dashboards that can be filtered, sorted, drill down into data, link dashboards.
• Quickly design with over 20 beautiful themes.
• Custom SQL queries right from your device.
• Bring your own custom visualizations into ReportPlus.
Access anytime:
• Sync and access your dashboards on your iPhone, iPad, and your desktop computer.*
• Secure your data with a passcode. Use TouchID to unlock it.
• Get answers without IT, No server side component required.
• Work offline.
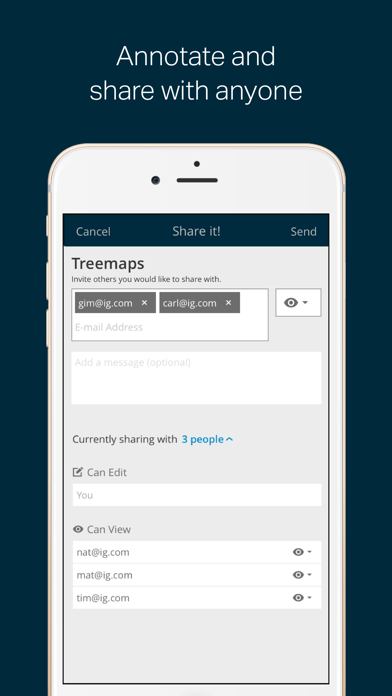
Share with anyone
• Invite others and collaborate.*
• Email an annotated screenshot.
• Nail your next presentation by exporting your dashboards and charts to PPT, PDF, and Word with your branding.
• Display dashboards on large screens via Airplay or HDMI.
It’s easy to get started
• Already use ReportPlus? Download the app for FREE and sign-in with your ReportPlus account.
• New to ReportPlus? Download the app, create two free dashboards. Create an account to access ReportPlus across devices and try it free for 30 days. Your free trial includes unlimited access to ReportPlus on your iPhone, iPad, and your desktop computer. No credit card required, and no obligation to purchase.
Subscribe
The ReportPlus subscription is optional, and the subscription features are available via an auto-renewing subscription.
ReportPlus offers a subscription of 1 year for $ 99.99 or 1 month for $9.99.
Payments will be charged to your credit card through your iTunes account after confirmation of purchase. Your subscription will automatically renew unless cancelled at least 24-hours before the end of the current period.
Your subscription can be managed in your iTunes Account Settings after purchase. Subscriptions cannot be cancelled for the current active period.
To learn about our privacy policy visit: http://www.infragistics.com/legal/privacy
*Available with a free trial or a subscription.
Reviews
Just wow
Gerneio
I’m impressed. And that doesn’t happen often in the iOS world anymore, let alone for this product to blow my mind in the first few hours of use and configuration. The learning curve is minimal, if you have a decent tech-know-how. Connected to my personal home SQL server and report server without any issue at all. Dashboards were really simple to setup. Loving it so far! Only “complaints” I have so far, is 1) PDF export on a SQL report doesn’t seem to export all the pages. Matter of fact, why is this labeled as IMG in dashboard? 2) column grouping/aggregating and custom functions require that you first perform a normal aggregate, mark it invisible (so it won’t show twice), then build the custom function. For example, unit conversion for something like in to ft, if I want the avg aggregate on the inches column, but I want it in feet, I have to first do the normal avg aggregate of the inches column, mark that column has not visible now, create custom function that points to this avg column, and perform my unit conversion calculation, rather than having the ability to do this all from the custom function “COUNT([inches])/12”. So right now, I have a workaround, but it seems redundant. 3) I feel like the exported PDF reports could have more formatting options. At the momment there is a lot of wasted space.
Good but forgot the simple stuff
Dwrldzmine
While this is a good app. It does not allow for sizing of columns and other polishing steps. Maybe in the future.
Awesome Dashboard
GeoRun2008
I have been using this app over the past 2 month. As much as I liked it, I was disappointed that you could not just refresh data on a local file. And was I surprise with the latest update, NOW YOU CAN. This is really a great app for anyone who needs to give regular reports on data. The ability do quickly creat nice looking charts, graphs, trend lines etc is amazing. Then to top it off you export it in to a very nice slide presentation. The one thing I would like to see is the ability to put your own logo on the slide template. It has the ReportPlus Pro logo, (not bad but for a presentation you want your own logo). There are way to many details to review here with this app, but it has been well thought out, and includes about anything you need for creating a dashboard. And to top this off the support is outstanding. Quick turn around time to email and actually help you. Look no more if you need to creat dashboards for reports. Great app!!!!!!
Awesome App
J_i_m_B
This app is an incredibly powerful and versatile tool for drawing together data from a variety of sources and displaying it in a meaningful manner. Thus far I have used it with several .csv files exported from our corporate BI software as well as a large number of SharePoint lists and continue to be impressed with how well it works. The description of this app as a self-service BI solution is absolutely correct and I couldn't be more pleased. Immediately after purchasing the app I contacted support for help with a minor issue related to our implementation and they have been very helpful and professional in reaching a resolution. I have nothing but the highest praise for the service we have received thus far. Many thanks!
love it but...
klr-need clarity
Absolutely love this and still cannot believe this is possible to do on an Ipad. Unfortunately, I have one strange issue currently that is severely limiting my ability to use this app. ReportPlus Lite allows Office365 Sharepoint Online access beautifully and multiple data sources. However, this paid version offers less data source options and the Office 365 authentication fails. I hope they resolve this very very soon.
Great Application!
Etsibert
I was able to consume my OData WCF Data Services, and ASP.net MVC Web API services and create a dashboard in less than 10 minutes. Great new features in the last upgrade as well!