Physics Toolbox Accelerometer
| Category | Price | Seller | Device |
|---|---|---|---|
| Education | Free | Chrystian Vieyra | iPhone, iPad, iPod |
This app can be especially useful for monitoring changes in acceleration in vehicles or airplanes, and to monitor vibrations of any sort. This app can be used in the classroom to hep students quantify activities with Newton's 2nd Law by taking a mobile device with the app on field trips to amusement park rides, roller coasters, or even in elevators for standard "elevator problems." Because G-Force is the ratio of normal force / weight of the object in question, students can the known mass of the object in question to quantitatively draw force diagrams throughout the object's motion.
Reviews
Bugs need to be fixed
Flokky_A
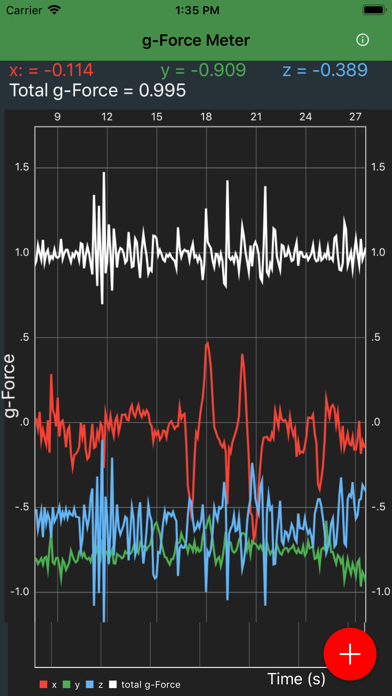
This version suppose to show accurate time scale. Initially, I think, it did, but on second opening all graphs disappeared and I only see moving timescale in thousands of something. There is no controls to pause or start like in previous version, that had time shown in unknown units. Needs to be improved.
accelerometer
ytcd
no good, no scale, can't record or save data. Deleted immediately, bummed it used any of my battery
Right idea but worthless
Mewto107
I downloaded this so I could measure g-force on roller coasters for school. But it doesn't have an option to record the graph during the ride. And you can't just hold your phone and write down measurements
Horribly inaccurate
Wastintime
Records 1.05G acceleration as 2.0+ and there's no ability to adjust the scale or anything. Worthless.
Physics Toolbox Accelerometer Application Review
AGS Pre-Calculus, GGC's Group
We used this app to track our acceleration of jumping, lunging, and running. With this app it was able to tell us the differences in our acceleration, and also did it in 3 different directions (even though we only used the x direction).Although it did accomplish what we needed it for, it did not keep track of the whole graph once you started the activity. The screen would keep moving and where ever you stopped your graph, which was at the end of your simulation, it made it hard for us to depict an accurate simulation/graph. Also another concern we had with the app was that we couldn’t physically see our Domain and Range. Domain due to the constant moving graph and Range due to if the acceleration went higher than our phones on the graph, we couldn’t see it, it didn’t expand. Another thing we questioned about the app was that it didn’t have graph lines to indicate the measurement of when it crossed the x-axis or just when the graph lines moved period. But back to some good things, it did show the acceleration, as for slowing down and speeding up pretty accurately. Whenever we would go faster the graph went up and whenever we slowed down the graph lines declined, and also since we jumped and lunged pour graphs should have contained some lines under the x-axis and it did. We would recommend this app to our friends or anyone who would need this app, without a problem.