iSpend - Expense Tracker
| Category | Price | Seller | Device |
|---|---|---|---|
| Finance | Free | Audacity Software Pte. Ltd. | iPhone, iPad, iPod |
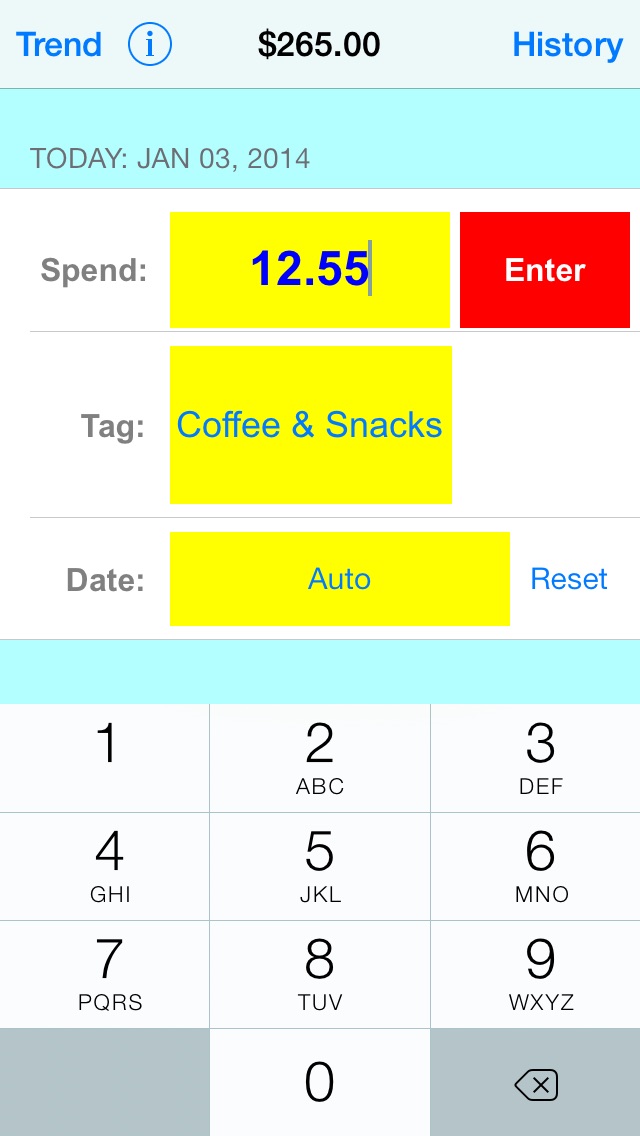
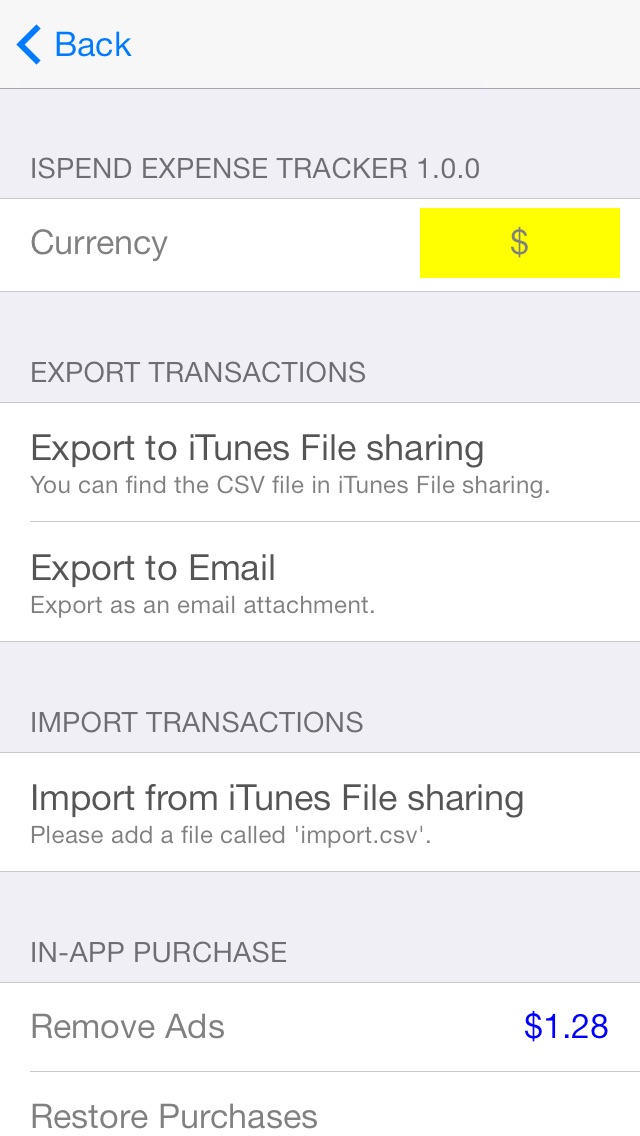
Entry can made at point of sale or by batch (good for if you keep the receipts).
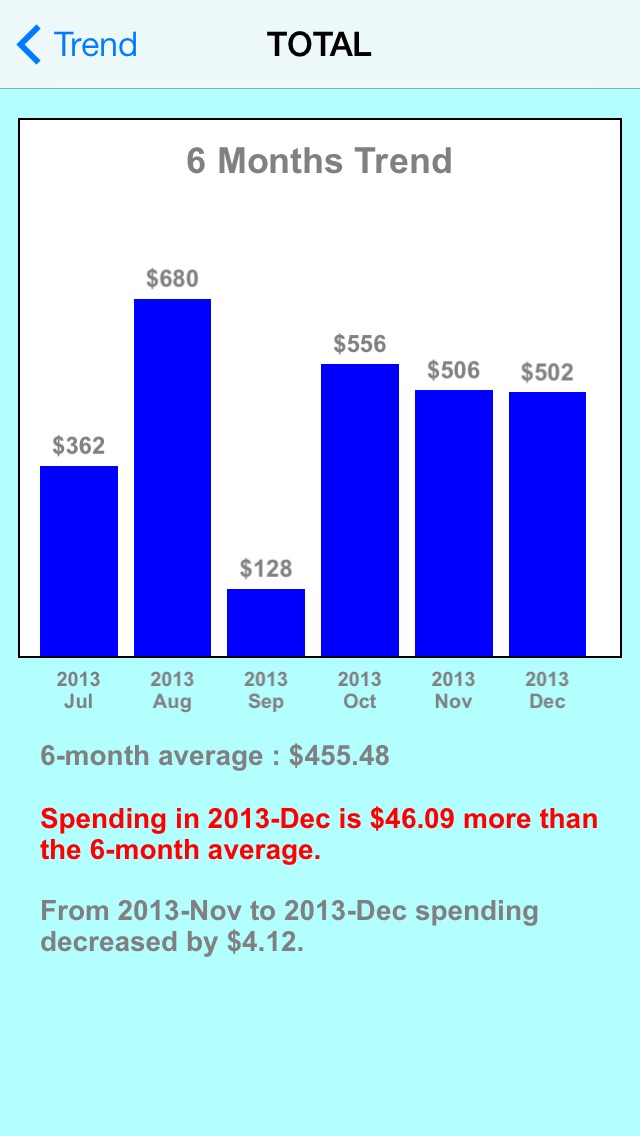
iSpend's bar graph allows you to view and analyze your 6-month spending trend by category or grand total to quickly identify overspending on a particular expense type. Useful stats are also provided such 6-month average spending, change in spending compared to previous month, and change in spending compared to 6-month average. If your expenditure is higher compared to the 6-month average or the previous month, the stats is highlighted in red.
Features:
* User friendly app with easy learning curve.
* Bar graph allows you to view your spending pattern over a 6-month period.
* Drill down to a specific item and view its spending trend.
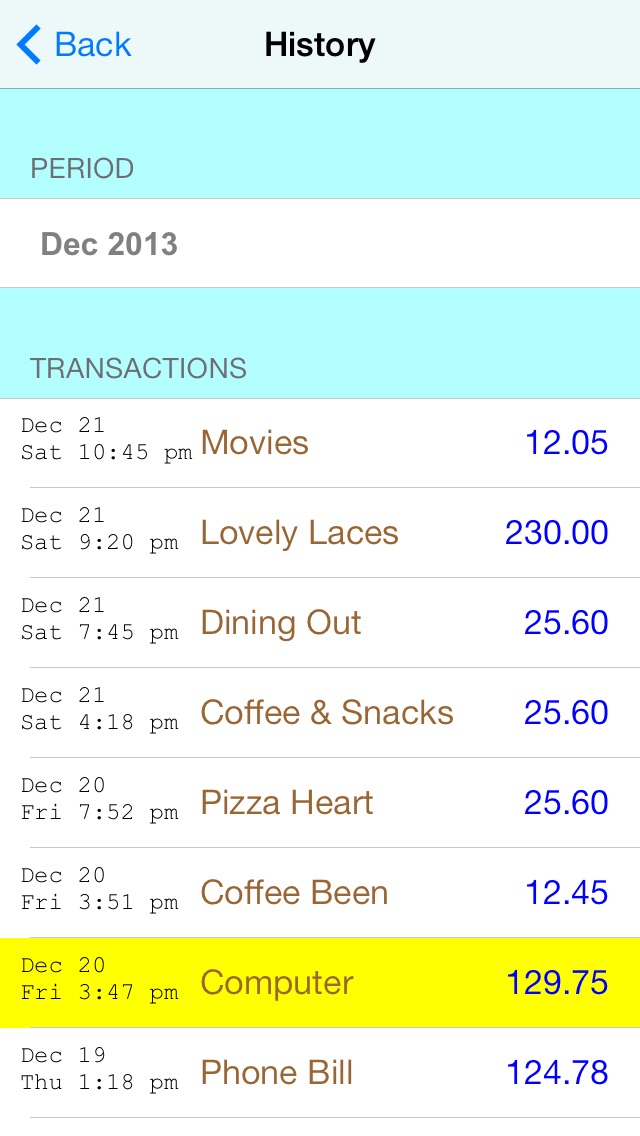
* View individual historical transactions.
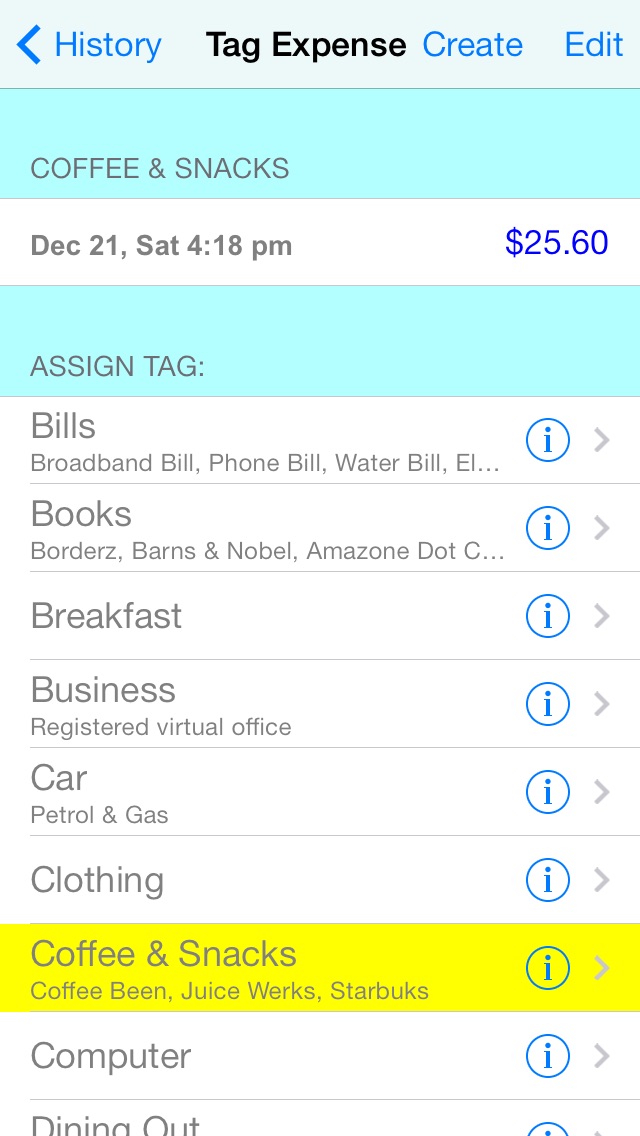
* Highly customizable categorization of expenses using tags and subtags.
* Useful statistical analysis of spending pattern.