Wolfram Statistics Course Assistant
| Category | Price | Seller | Device |
|---|---|---|---|
| Education | $1.99 | Wolfram Group LLC | iPhone, iPad, iPod |
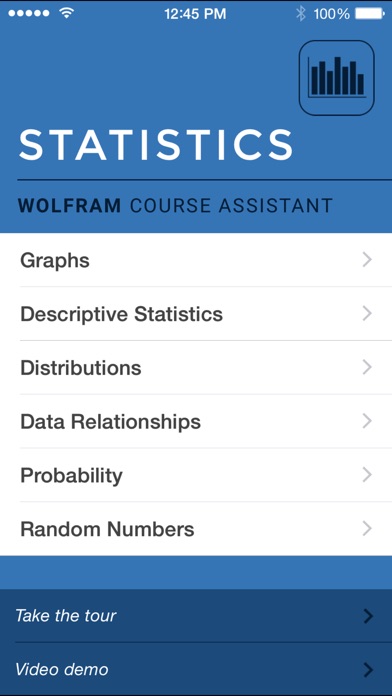
This app covers the following topics applicable to Statistics and Introduction to Statistics:
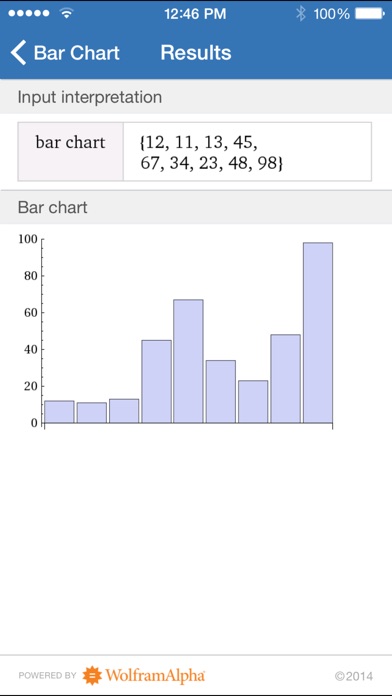
- Create a bar chart, histogram, or scatter plot of any set of data
- Find the mean, median, mode, standard deviation, quartiles, and interquartile range of a dataset
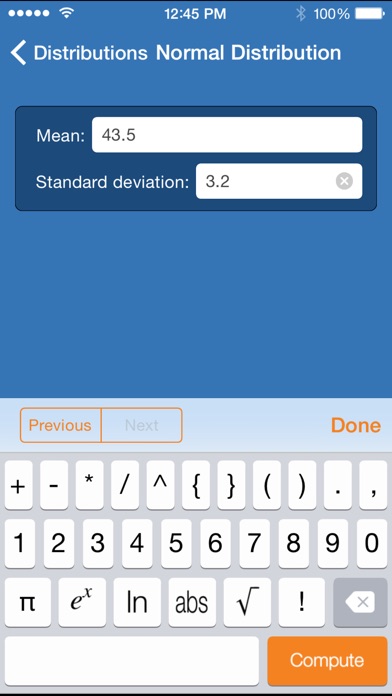
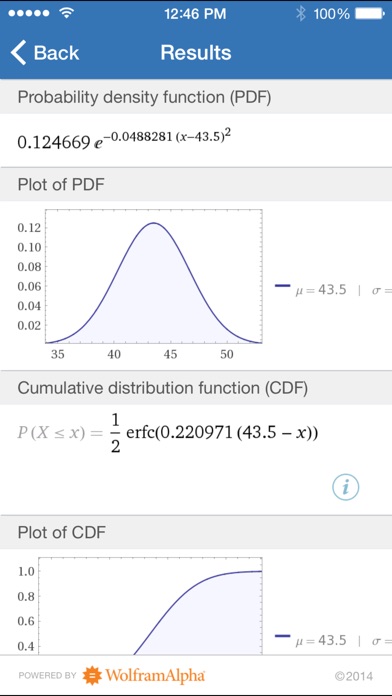
- Calculate normal probabilities and find information about the normal distribution
- Calculate binomial probabilities and find information about the binomial distribution
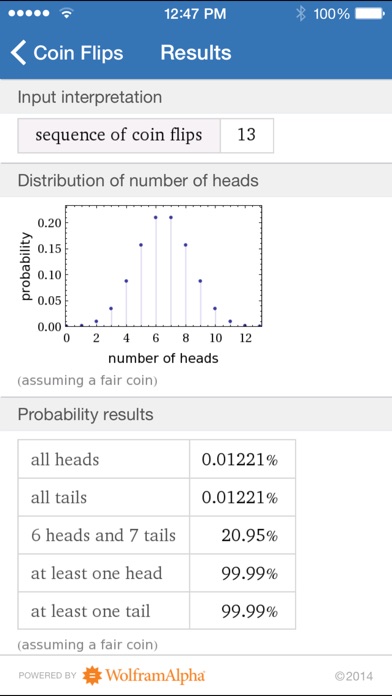
- Compute probabilities based on dice rolls and coin flips
- Find the best-fit line of a set of data points
- Select random integers or random real numbers
The Wolfram Statistics Course Assistant is powered by the Wolfram|Alpha computational knowledge engine and is created by Wolfram Research, makers of Mathematica—the world's leading software system for mathematical research and education.
The Wolfram Statistics Course Assistant draws on the computational power of Wolfram|Alpha's supercomputers over a 3G, 4G, or Wi-Fi connection.
Reviews
Data edit
Larrygps
I too was disappointed. I had expected to be able to enter data once and make all various calcs. But I can't edit data, it's not useful. The stats registers on my 30 yr old calculator far far better. With Wolfram I was expecting a tool that was useful. May I get my $2 back? Please?
Worth It's Weight in Gold
GigaPan
If it can help me win at poker, or figure my life expectancy, or determine the quickest route to happiness or even help me pass Statistics.
Disappointed
Gometric
I expected so much more from Wolfram. StatViz is a much more intuitive and comprehensive program. Where are the confidence intervals, hypothesis tests or ANOVA. The distributions are sparse. I can only hope that updates will be free and add much more functionality. This project seems like it was rushed out the door.
Data Science
rob66569
Statistics is about data, and the biggest drawback of this app is that the interface for inputting data is lousy. At best, this serves as a simple calculator for toy problems. No way any student could examine a real data set with hundreds of rows and more than two variables. Even including two variables is awkward here, because they must be input in (x1,y1), (x2,y2)....format. The graphics are fine (hence two stars) and there are some nice interactive touches, but this is a toy. As an intermediate step between toy and data analysis device, it might be nice if they would include some pre-installed real data sets that include an interesting context and demonstrate that the analyses actually can contribute to knowledge about real phenomenon.
Looks nice but...
Brandon Pierce
It takes FOREVER to type in data. Having to type it in isn't so bad, but there is a several second delay between each key press. This makes the app fairly unusable.
Pretty good app
ajspeller
I would like to see combination and permutation calculations added. It would be cool if you could enter data from a chart, maybe a 3x3 or configurable rows & columns, and figure out the probability. I don't believe I saw a z-score calculator but that would be nice too.
Terrible app
Katherine_LI_NY
This app is a ***terrible*** tool for a statistics class. The interface is not user friendly and it is painfully difficult to input data. There is also no way to compare across data sets once each set is entered - you have to start all over again. Most of the tools such as those for probability and data relationships, will never be of use to a real student in a class...the tools that we actually need, like for ANOVA, are not included. Save your money and do NOT purchase this app.