SAP Analytics Cloud Roambi
| Category | Price | Seller | Device |
|---|---|---|---|
| Business | Free | SAP SE | iPhone, iPad, iPod |
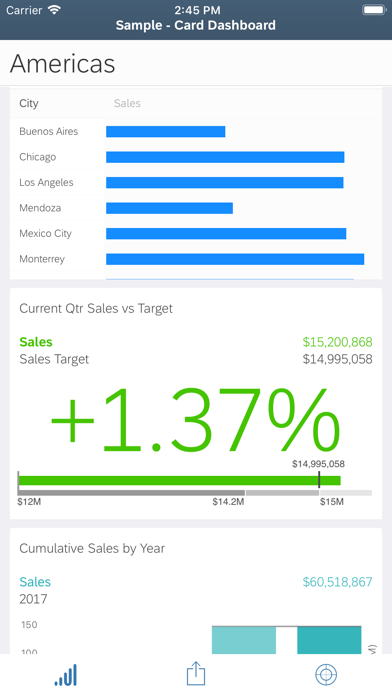

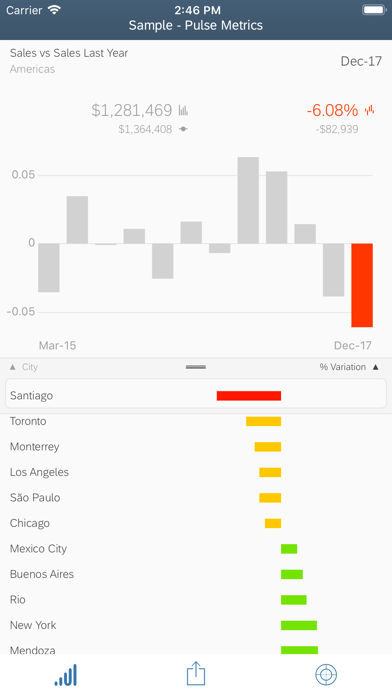
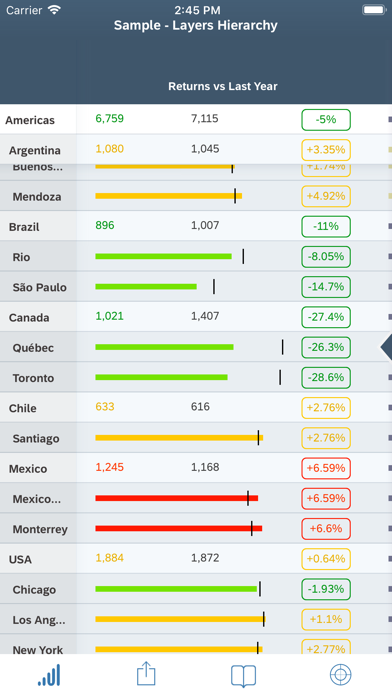
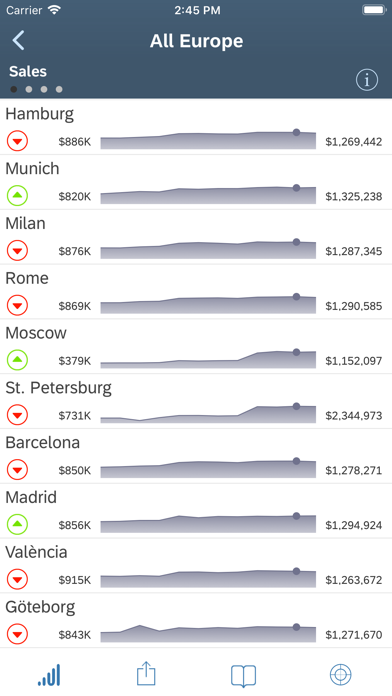
Designed from the ground up for mobile users, Roambi is the leading app for creating and delivering rich, interactive reports, charts, dashboards, KPIs, analytics, and data visualizations that were designed from the ground up for mobile users.
Easily take data from anywhere, like Excel, Google Spreadsheets, Box, Salesforce.com, BI systems, databases and more, and transform it into stunning visualizations for mobile with 100% offline access.
Import any CSV file directly into Roambi and turn it into an easy to use analytic that let’s you instantly filter, pivot, and analyze your data, or use our online publishing application to create and publish award winning visualizations to any user on any device.
Roambi is used by thousands of companies, big and small around the globe to provide on-the-go employees with the data they need in a format they can understand - anytime, anywhere.
Reviews
What was Old, is New again
A1 Yolaa
I have a use for this App again!! Now that Data Analysis is in Vogue?. The Functionality you get on Mobile can't be Overstated. It's very Immersive, for the Audience and Presenter. Visually appealing also. Downloaded while it's free!
What was Old, is New again
A1 Yolaa
I have a use for this App again!! Now that Data Analysis is in Vogue?. The Functionality you get on Mobile can't be Overstated. It's very Immersive, for the Audience and Presenter. Visually appealing also. Downloaded while it's free!
Auto Downloading fails
photographyandme
Favorite reports used to download daily. Now they do not. Makes the app much less useful.
hard to learn and harder to buy...
Boulder Jack
I was immediately enthralled with Roambi Analytics...cool looking graphs that are easy to create...except that after spending 4 hours trying to learn the program I was more confused than when i started. I must have gotten lucky with some early attempts to build simple graphs. But I sallied forth and decided to buy two licenses for $528. Big mistake. I paid one of my people to spend 40 hours learning the program and he was only moderately successful. And 3 weeks after committing to buy the program, they still haven't given me a login or password...something about "provisioning" taking time...seems ridiculous...and my impression that since SAP bought Roambi it has become part of the problem not the solution. Short answer: sexy idea but ease of use is an unfulfilled promise. And support at all levels is, while very nice, surprisingly unhelpful. Recommendation: Don't waste your time.
Makes Life Easier
ccayag03
It makes my info available wherever I am in an easy to understand format.
Beautiful visualization
rickster2009
Roambi has some of the most beautiful data visualizations I have ever seen. It's ability to present multiple dimensions in an interactive way makes it easy to consume a ton of information in very little time.
Easy as pie
Ilanan
We used this app to vote on a contest at work, and it was really neat to see the live updated results. I casted my vote and moments later, I could see that my vote was part of the pie chart. Very cool!
My new obsession
Versca
This App is the key to my business success. It opened my eyes to the reality of my business! Now I make decisions that really impact the outcome in a positive way.