Easy Pivot Point
| Category | Price | Seller | Device |
|---|---|---|---|
| Finance | Free | Easy Indicators LLP | iPhone, iPad, iPod |
It is common to derive additional levels of support and resistance, below and above the pivot point, respectively, by subtracting or adding price differentials calculated from previous trading ranges of the market.
A pivot point and the associated support and resistance levels are often turning points for the direction of price movement in a market. In an up-trending market, the pivot point and the resistance levels may represent a ceiling level in price above which the uptrend is no longer sustainable and a reversal may occur. In a declining market, a pivot point and the support levels may represent a low price level of stability or a resistance to further decline.
Pivots are especially popular in the FX market since many currency pairs do tend to fluctuate between these levels. Range-bound traders will enter a buy order near identified levels of support and a sell order when the asset nears the upper resistance. Pivot points also enable trend and breakout traders to spot key levels that need to be broken for a move to qualify as a breakout.
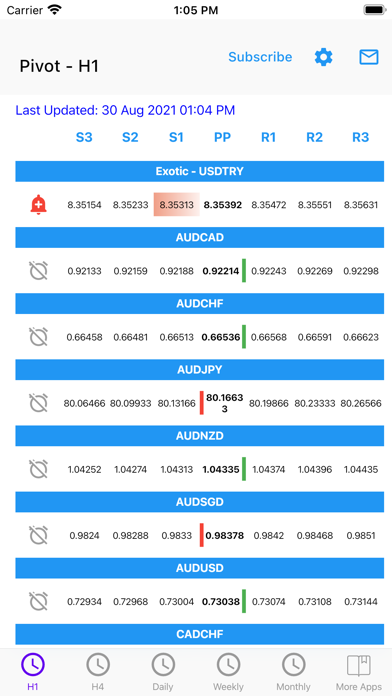
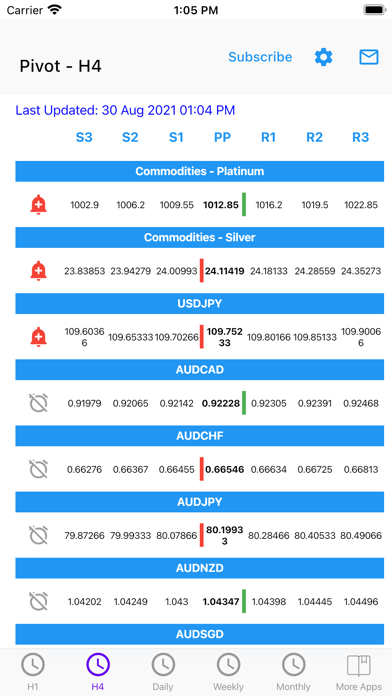
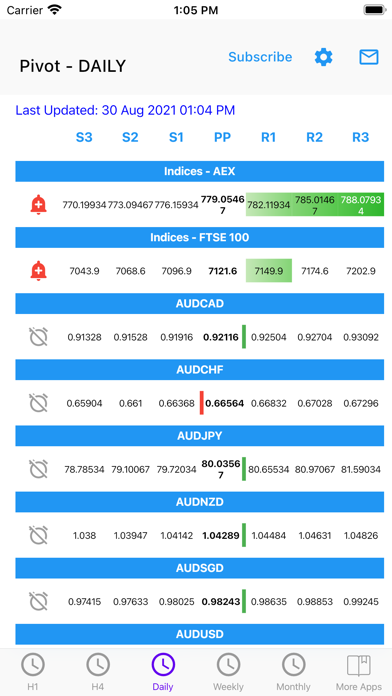
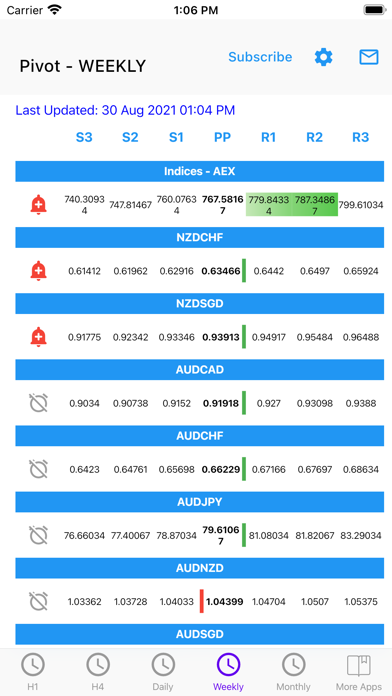
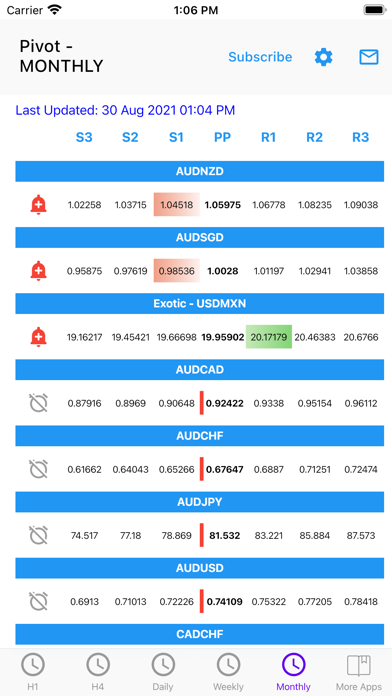
Easy Pivot Point automatically calculate and present the pivot point with resistance and support levels for each major currency pair on an easy to read dashboard.
Please note that pivot points are short-term trend indicators which is only useful for the current day trading.
Key features
- Timely display of pivot points with 3 levels of support and resistance for 37 currency pairs,
- Two display modes are available. In simple mode, only the general market sentiment and status of the resistance/support level will be displayed. In the detailed mode, the actual value of the pivot points and resistance/support prices will be displayed.
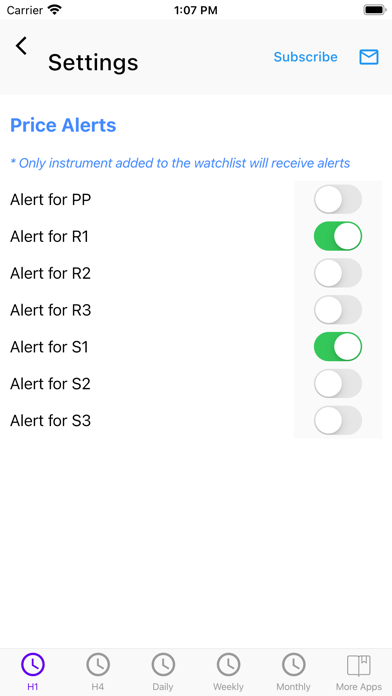
- Allows you to create your own watch list to monitor only those currency pairs you are interested in.
- Display headline news of your favourite currency pair(s).
- Quick access to other related trading tools developed by us including several popular indicators.
If you choose to subscribe to our Premium plan, payment will be charged to your iTunes account, and your account will be charged for renewal 24 hours prior to the end of the current period. Auto-renewal may be turned off at any time by going to your settings in the iTunes Store after purchase. No cancellation of the current subscription is allowed during active subscription period.
Current price of subscription is $4.99 USD every 3 months and may vary from country to country.
Privacy Policy: http://easyindicators.com/privacy.html
Terms of Use: http://easyindicators.com/terms.html
To learn more about us and our products, please visit www.easyindicators.com .
All feedback and suggestions are welcome. You can reach us via email ([email protected]) or the contact feature within the app.
Join our facebook fan page.
http://www.facebook.com/easyindicators
Follow us on Twitter (@EasyIndicators)
Reviews
Best app great developer
anon afre
Do u have alerts for this app? Edit: thanks for adding the alerts you guys are really the best I appreciate ?
Sub
Wasteoftimeee
I want to subscribe! If I pay for one app do I get subscription to all of your apps?
Why?
Ghost_mofo
Why does it always ask me to sign in my iCloud every time I open the app? Also it stopped refreshing the data. All these started when I ‘updated’ to the latest version. I prefer the old version.